

The United States has an influenza season where more people than usual suffer from the flu. Some people, particularly those in vulnerable populations, develop serious complications and end up in the hospital. Hospitals and clinics need additional staff to adequately treat these extra patients. The medical staffing agency provides this temporary staff.
Determine when to send staff, and how many, to each state.
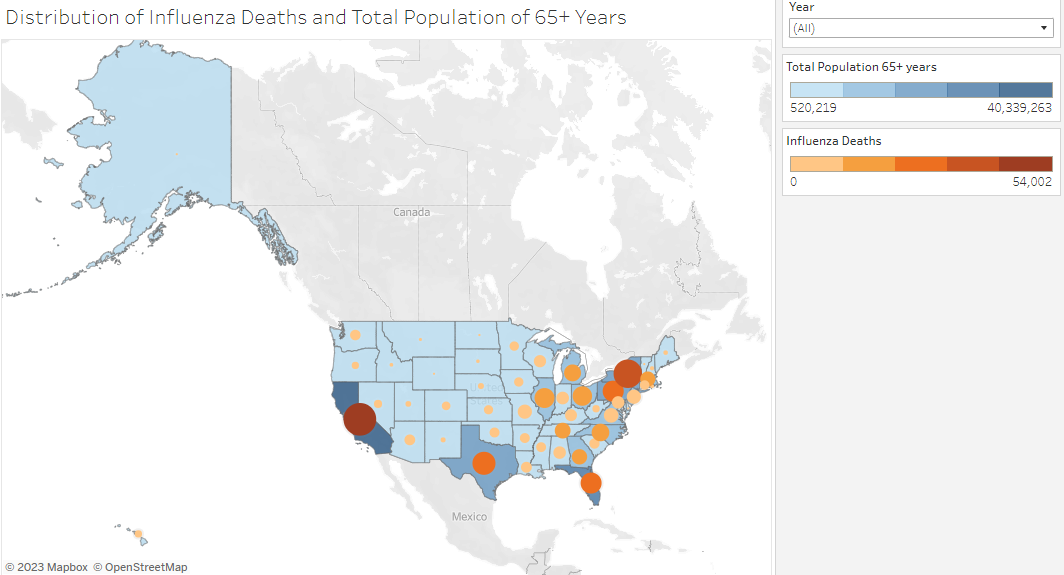
The agency covers all hospitals in each of the 50 states of the United States, and the project will plan for the upcoming influenza season.
This project was broken down into two phases, the first is designing the research project and conducting the analysis through Excel. The second was conducting an analysis in Tableau and using Tableau to present the data story. It was my first-time learning Tableau, so it was a bit of a learning curve for me. As I progressed through the project, there were times when I wanted to go back and start over. Towards the end of the project, I wanted to utilize additional datasets, but was unable to due to time constraints.
The United States has an influenza season where more people than usual suffer from the flu. Some people, particularly those in vulnerable populations, develop serious complications and end up in the hospital. Hospitals and clinics need additional staff to adequately treat these extra patients. The medical staffing agency provides this temporary staff.
Determine when to send staff, and how many, to each state.
The agency covers all hospitals in each of the 50 states of the United States, and the project will plan for the upcoming influenza season.
This project was broken down into two phases, the first is designing the research project and conducting the analysis through Excel. The second was conducting an analysis in Tableau and using Tableau to present the data story. It was my first-time learning Tableau, so it was a bit of a learning curve for me. As I progressed through the project, there were times when I wanted to go back and start over. Towards the end of the project, I wanted to utilize additional datasets, but was unable to due to time constraints.
The datasets utilized for this project:
I utilized two datasets for this project. I started by creating a data profile for each dataset. Then I investigated the data integrity by looking at the accuracy and consistency of the data. Then I conducted an initial round of data cleaning of each dataset. Next, I conducted data quality measures, in which I located and removed any missing values and duplicate records. Lastly, I transformed both datasets in order to utilize VLOOKUP() to merge the dataset.
Conclusion
Recommendations